Trajectory Fluid
By Donghao Ren and John O'Donovan
Network data is ubiquitous. Visual representations can help people gain insights about the underlying data. This installation presents an artistic approach towards understanding how people perceive and analyze network data in different visual representations.
Node-link visualization, 50-node network, all 16 tasks.
The fundamental data units of the installation are mouse trajectories. Each trajectory is a sequence of mouse movements and annotations performed while a person interacts with a network visualization to complete a given task, such as finding the shortest path between two nodes. Mouse trajectories can provide insights into the mental processes of people making decisions regarding workflow or trying to comprehend the structure of networks. A dataset of 9,600 mouse movement trajectories from a large-scale cognitive experiment with 600 Amazon Mechanical Turk participants was used. In the experiment, each participant was asked to perform 16 question-answering tasks on one of two networks of different sizes and one of three visual representations. Specifically, these were a node-link graph, a matrix ordered by group and a matrix ordered by node degree.
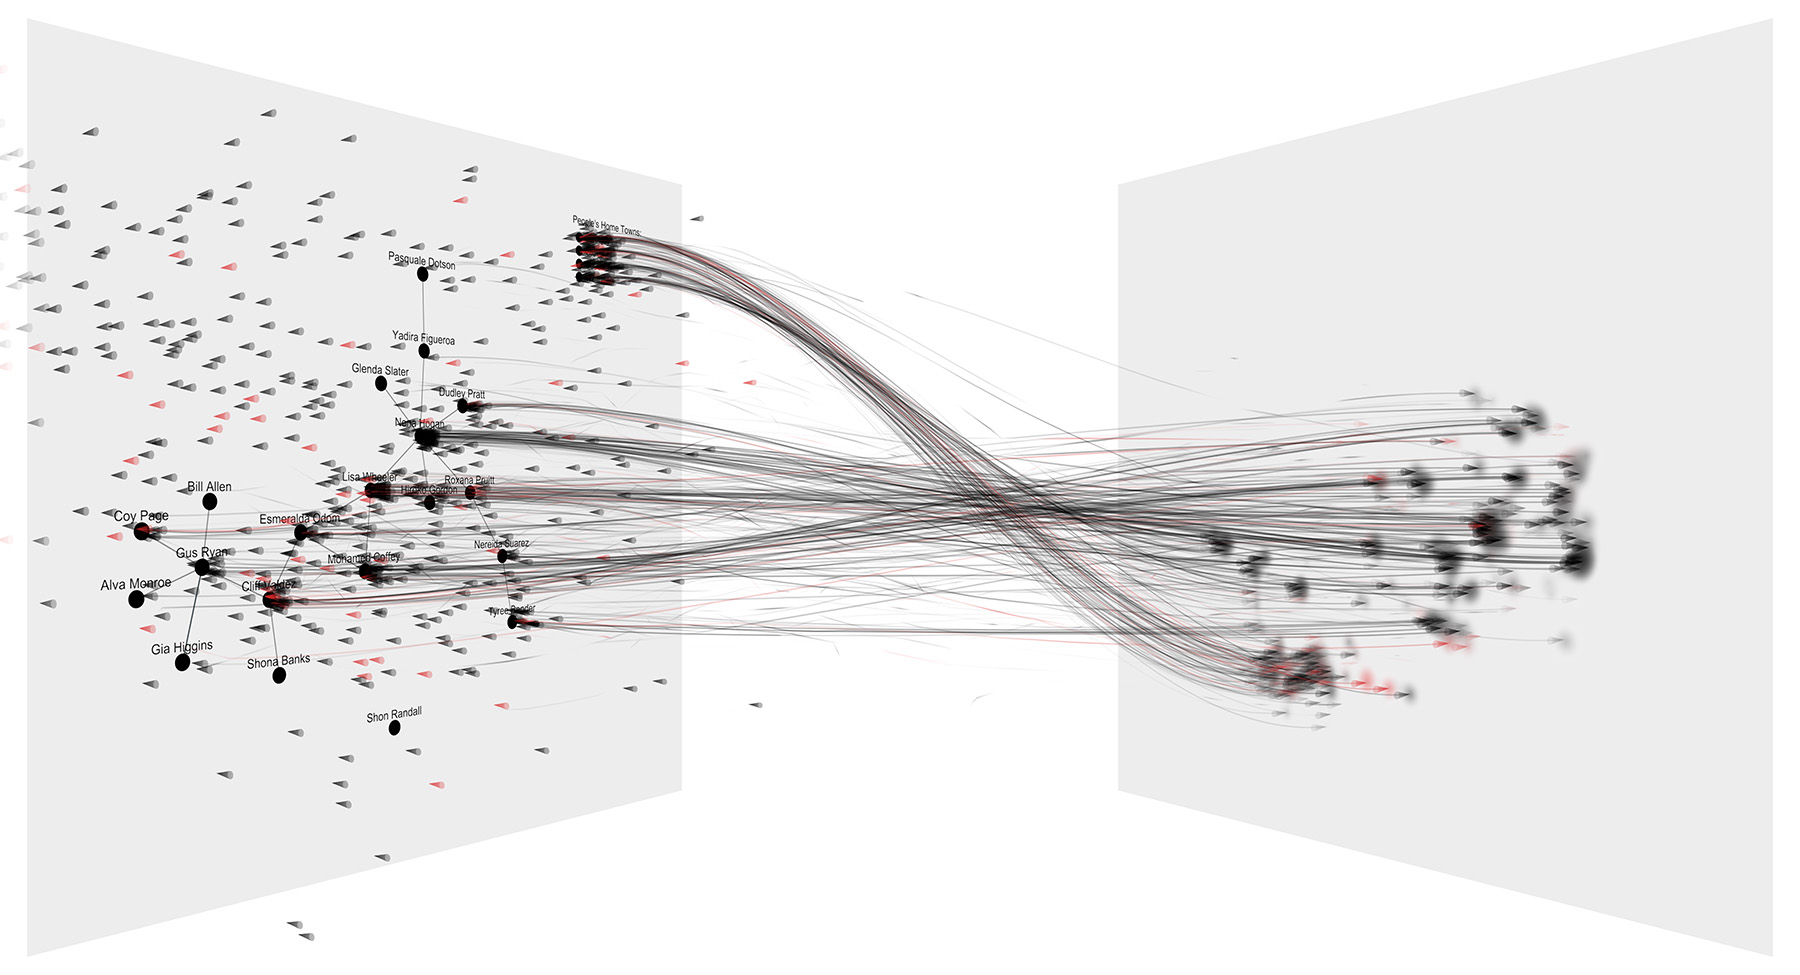
Node-link visualization, 20-node network, all 16 tasks.
In this installation, the trajectories are revealed in two spaces: the screen space and the abstract space. In the screen space, the trajectories are presented on the visualization in real-time. Each moving cone represents a single trajectory. The abstract space, which maps each trajectory to a single point, aims to capture the similarities and dissimilarities between trajectories. It is computed using Laurens van der Maaten and Geoffrey Hinton’s t-SNE (t-Distributed Stochastic Neighbor Embedding) algorithm with the DTW (Dynamic Time Warp) distance. Three-dimensional Hermite splines are drawn to connect the screen space and the abstract space. The visual encoding maps correctness to color (red means incorrect) and the information of the visualization to luminance. Annotation actions are rendered as semi-transparent bands alongside the splines. Mouse movements and annotations in the screen space generates turbulence that propagates to the abstract space among the lines, which resembles a “fluid” from the screen space to the abstract space.
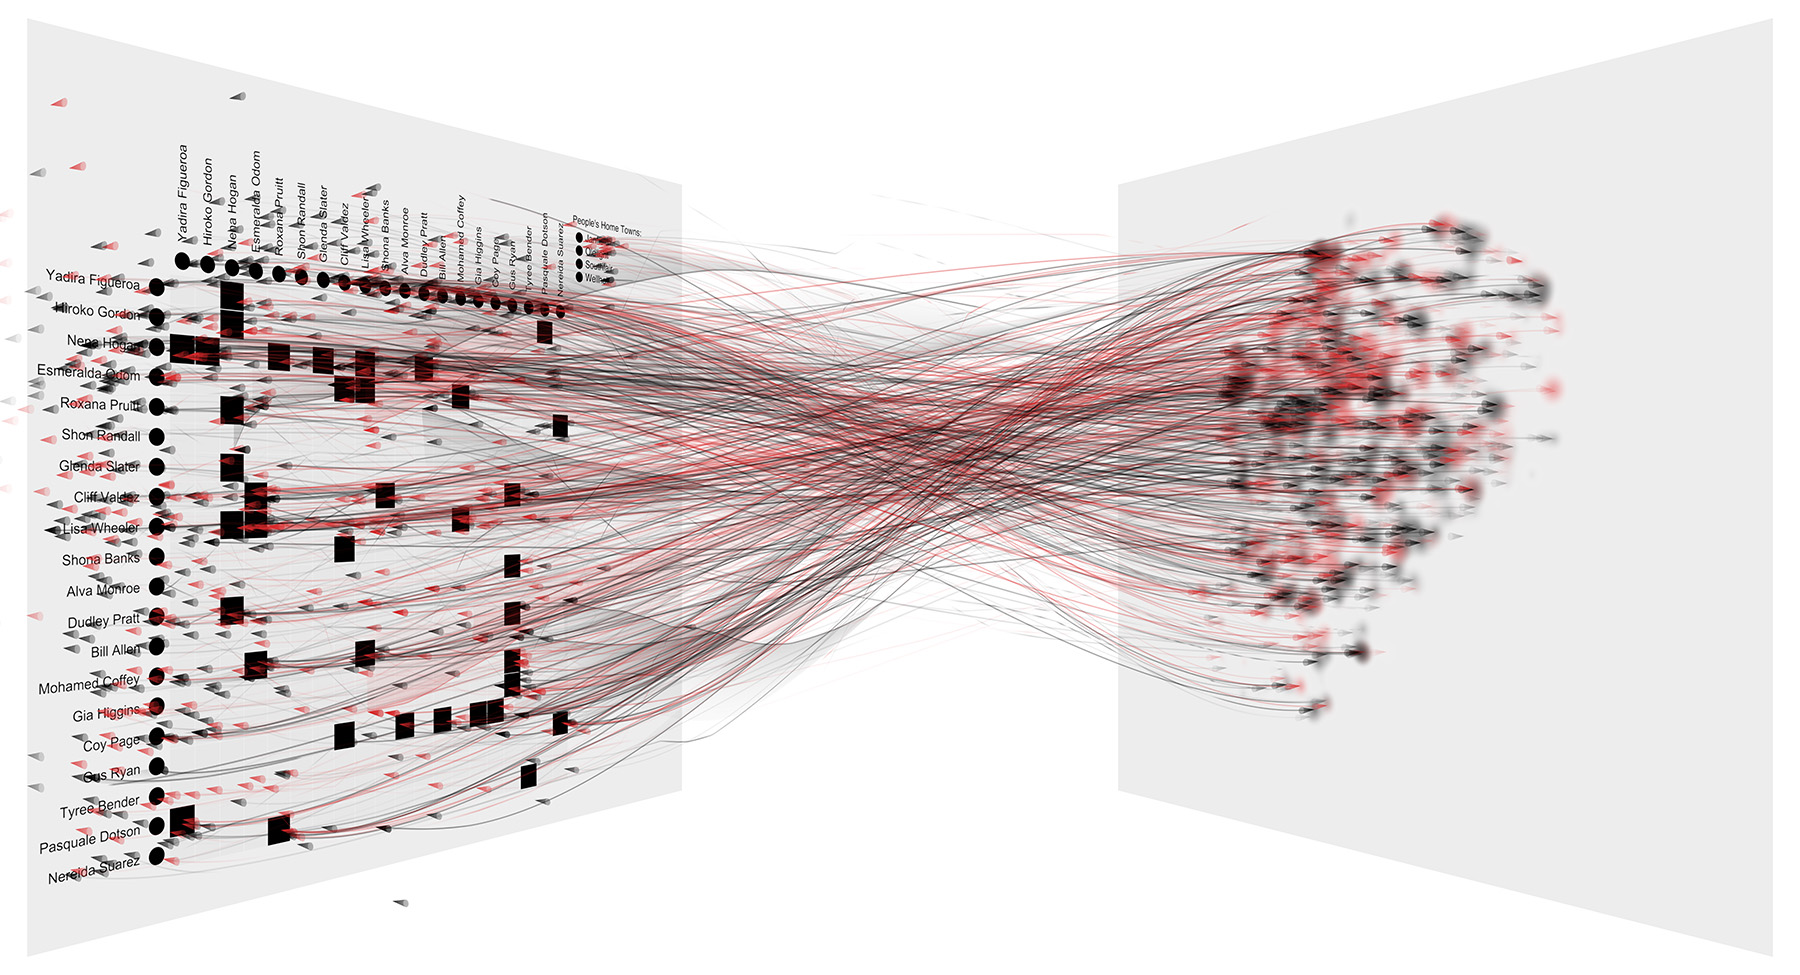
Matrix visualization (ordered by attribute), 20-node network, all 16 tasks.
The audience can interactively explore each of the 6 combinations of visual representations and network sizes on all or specific task types. Various patterns on these combinations manifest the differences between the nature of these visual representations, network sizes and tasks.