Fertility Rate vs. Life Expectancy
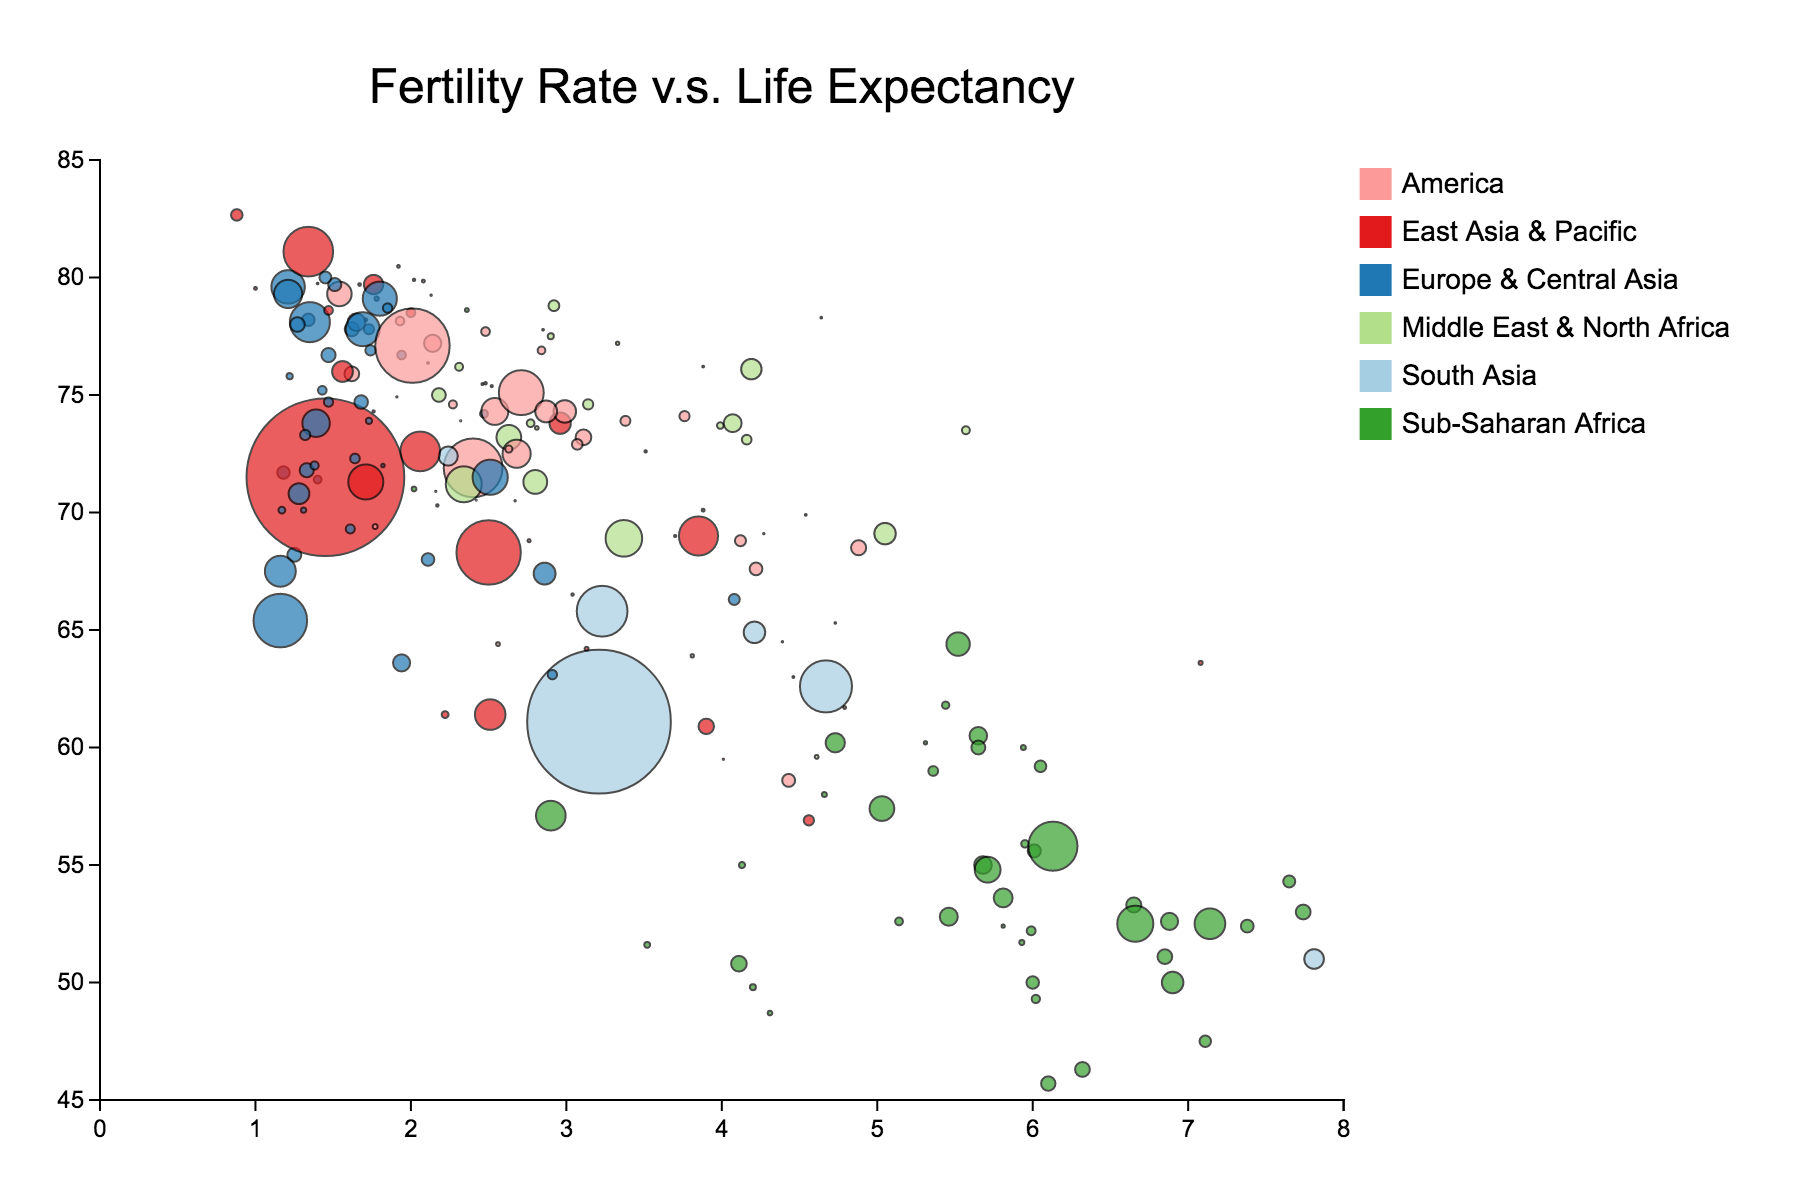
A bubble chart displaying the fertility rate, life expectancy, and population of countries in six world regions. Each circle represents a country. The size of a circle represents the country’s population and its color represents its world region. Fertility rate increases along the X axis while life expectancy increases along the Y axis.
Data Source
Retrieved from Gapminder
Download Dataset (.csv)Creation Process