Getting Started
This page describes four things that you need to learn in order to use Charticulator.
Terminology
-
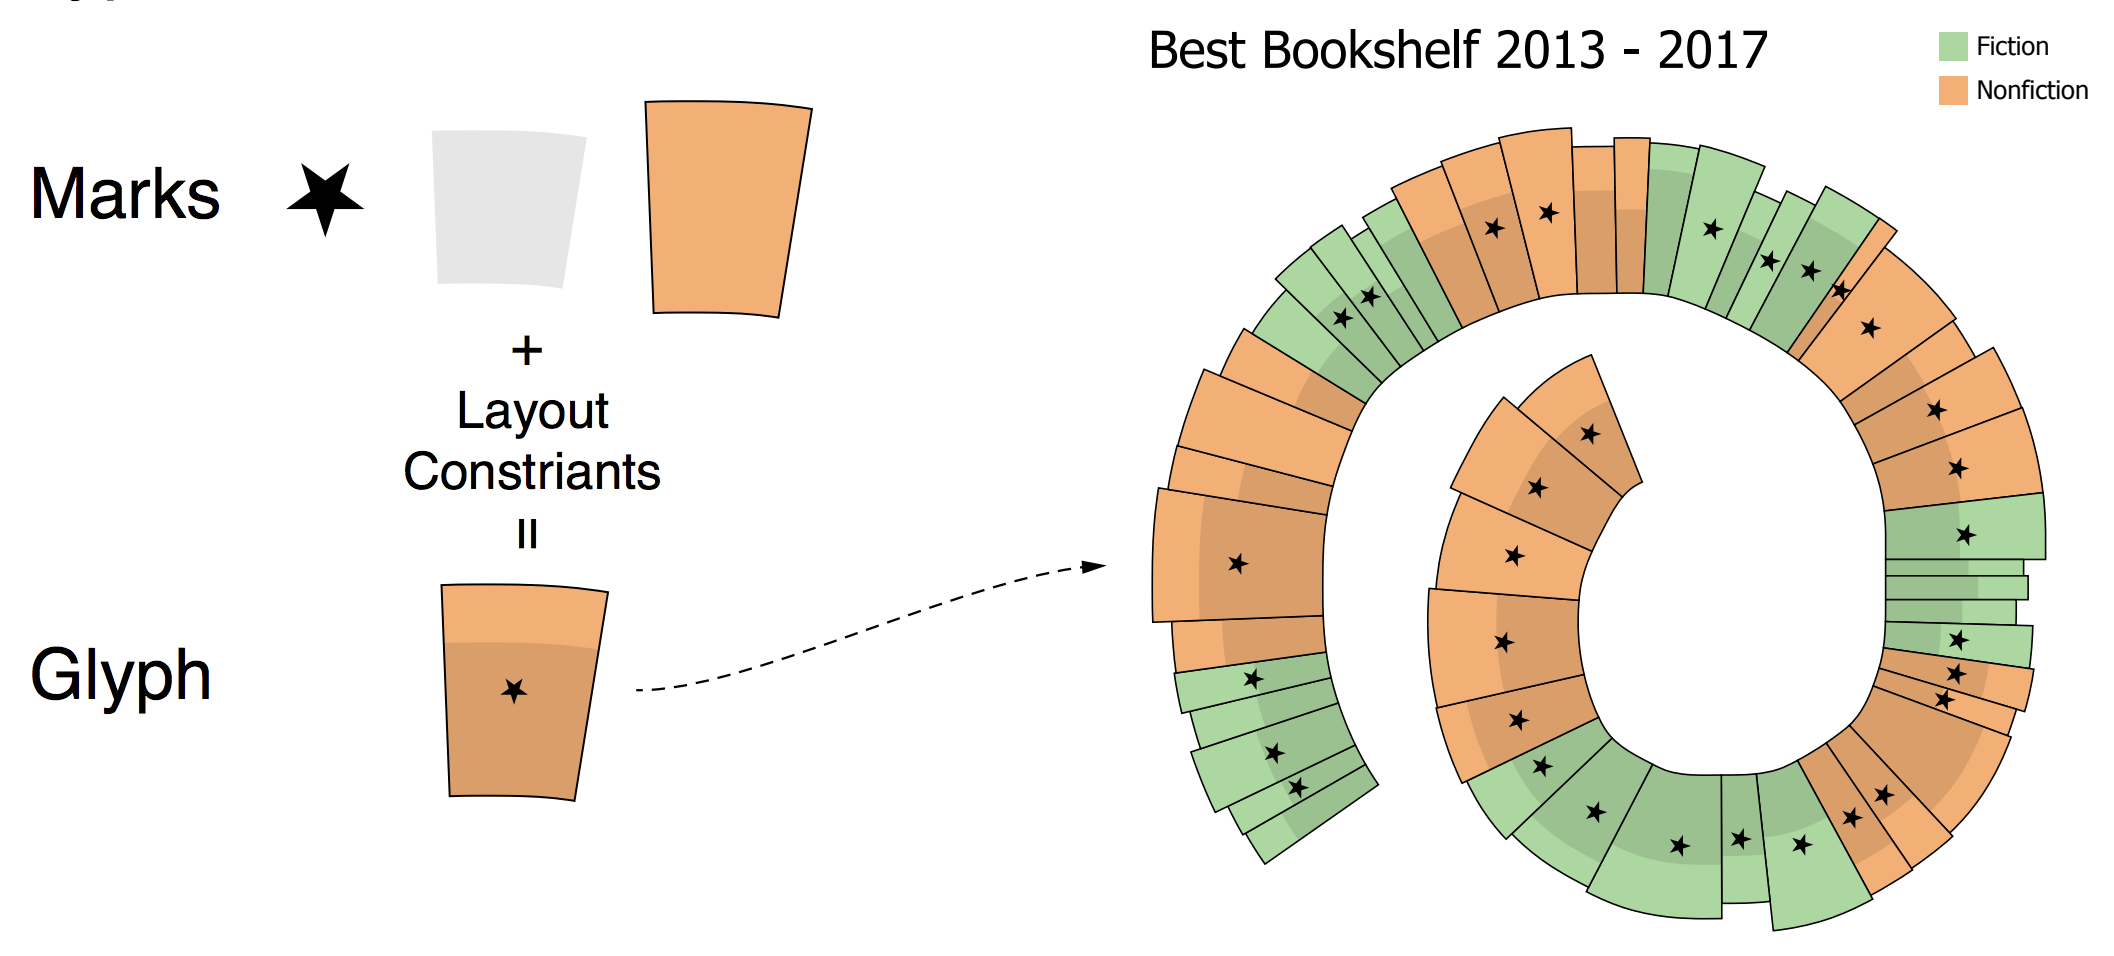
A mark is a primitive graphical element (e.g., rectangle, line, text).
-
A glyph is a visual representation of a single data row. A glyph contains one or more marks.
-
A guide is an auxiliary element for positioning marks or glyphs. Guides do not appear in exported charts.
-
A plot segment lays out a set of glyphs.
-
A scaffold or an axis specifies the layout property of one particular direction in a plot segment. A scaffold specifies a basic stacking layout without data binding and an axis specifies a layout that is bound to properties of the data. An axis can position glyphs according to a categorical data attribute or to a numerical data attribute.
User Interface Components
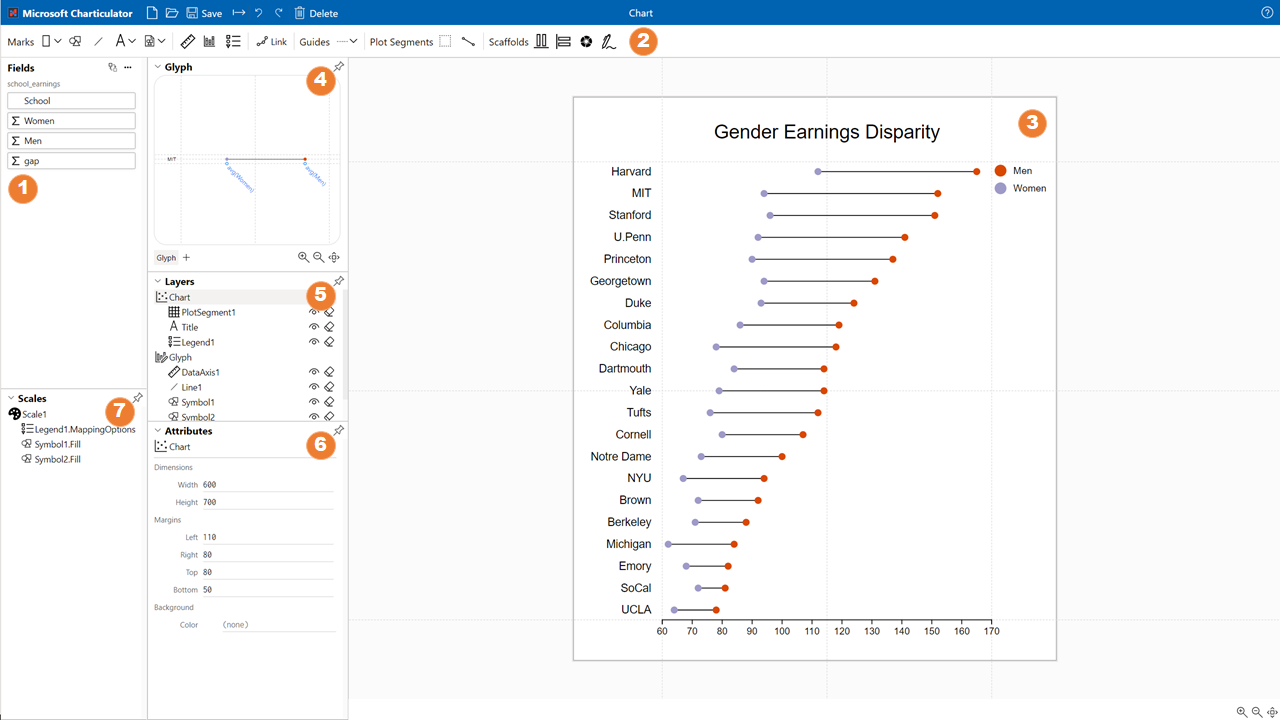
Charticulator’s user interface consists of the following components:
-
Dataset Panel: listing the columns in your dataset. Click the “…” button to view the actual data values.
-
Toolbar: widgets for specifying Marks, Links, Guides, Plot Segments, and Scaffolds.
-
Chart Canvas: a canvas for specifying the chart design.
-
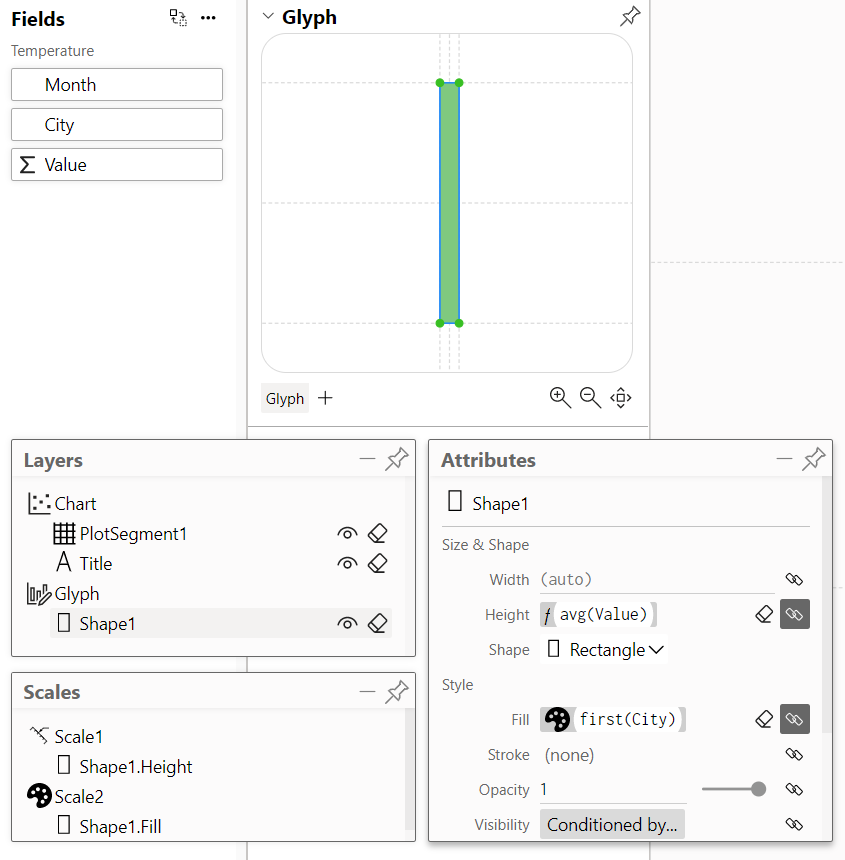
Glyph Editor: a canvas for specifying the glyph design.
-
Layers Panel: listing the contents of the chart and glyph designs.
-
Attributes Panel: widgets for specifying the attributes and data bindings for each layer.
-
Scales Panel: listing the scales used in the chart.
You can customize the position, size, and docking status of the Glyph Editor, Layers Panel, Attributes Panel, and Scales Panel. Click the dock status icon in the top right corner of each view to toggle its docking status. When the view is undocked, you can change its position and size.
Help Menu
Click the help icon in the top right corner to reveal links to several resources, including a link to this Getting Started page, the Example Gallery, a link to create an issue in our Github repository, the Charticulator main website, and a link to contact us via email.
Preparing Data
Charticulator supports datasets in CSV format and expects that the first row contains the column names. Charticulator is disigned to support both the wide and narrow format of a data table.
Narrow
The table below shows (in narrow form) the maket share of mobile operating systems from one year to the next.
| Year | OperatingSystem | MarketShare |
|---|---|---|
| 2009 | iOS | 59.35 |
| 2009 | Android | 5.58 |
| 2009 | Symbian | 2.5 |
| 2010 | iOS | 40.77 |
| 2010 | Android | 16.97 |
| ... | ... | ... |
Wide
The table below shows (in wide form) the world population by gender and age. Becuase a glyph represents one data row, you need to use a data-driven guide to position multiple marks based on numerical data values in a glyph.
| Age | Female | Male |
|---|---|---|
| 0-4 | 327.601 | 350.321 |
| 5-9 | 316.714 | 338.892 |
| 10-14 | 301.011 | 322.363 |
| 15-19 | 288.482 | 308.333 |
| 20-24 | 287.820 | 306.100 |
| ... | ... | ... |
Data for Links
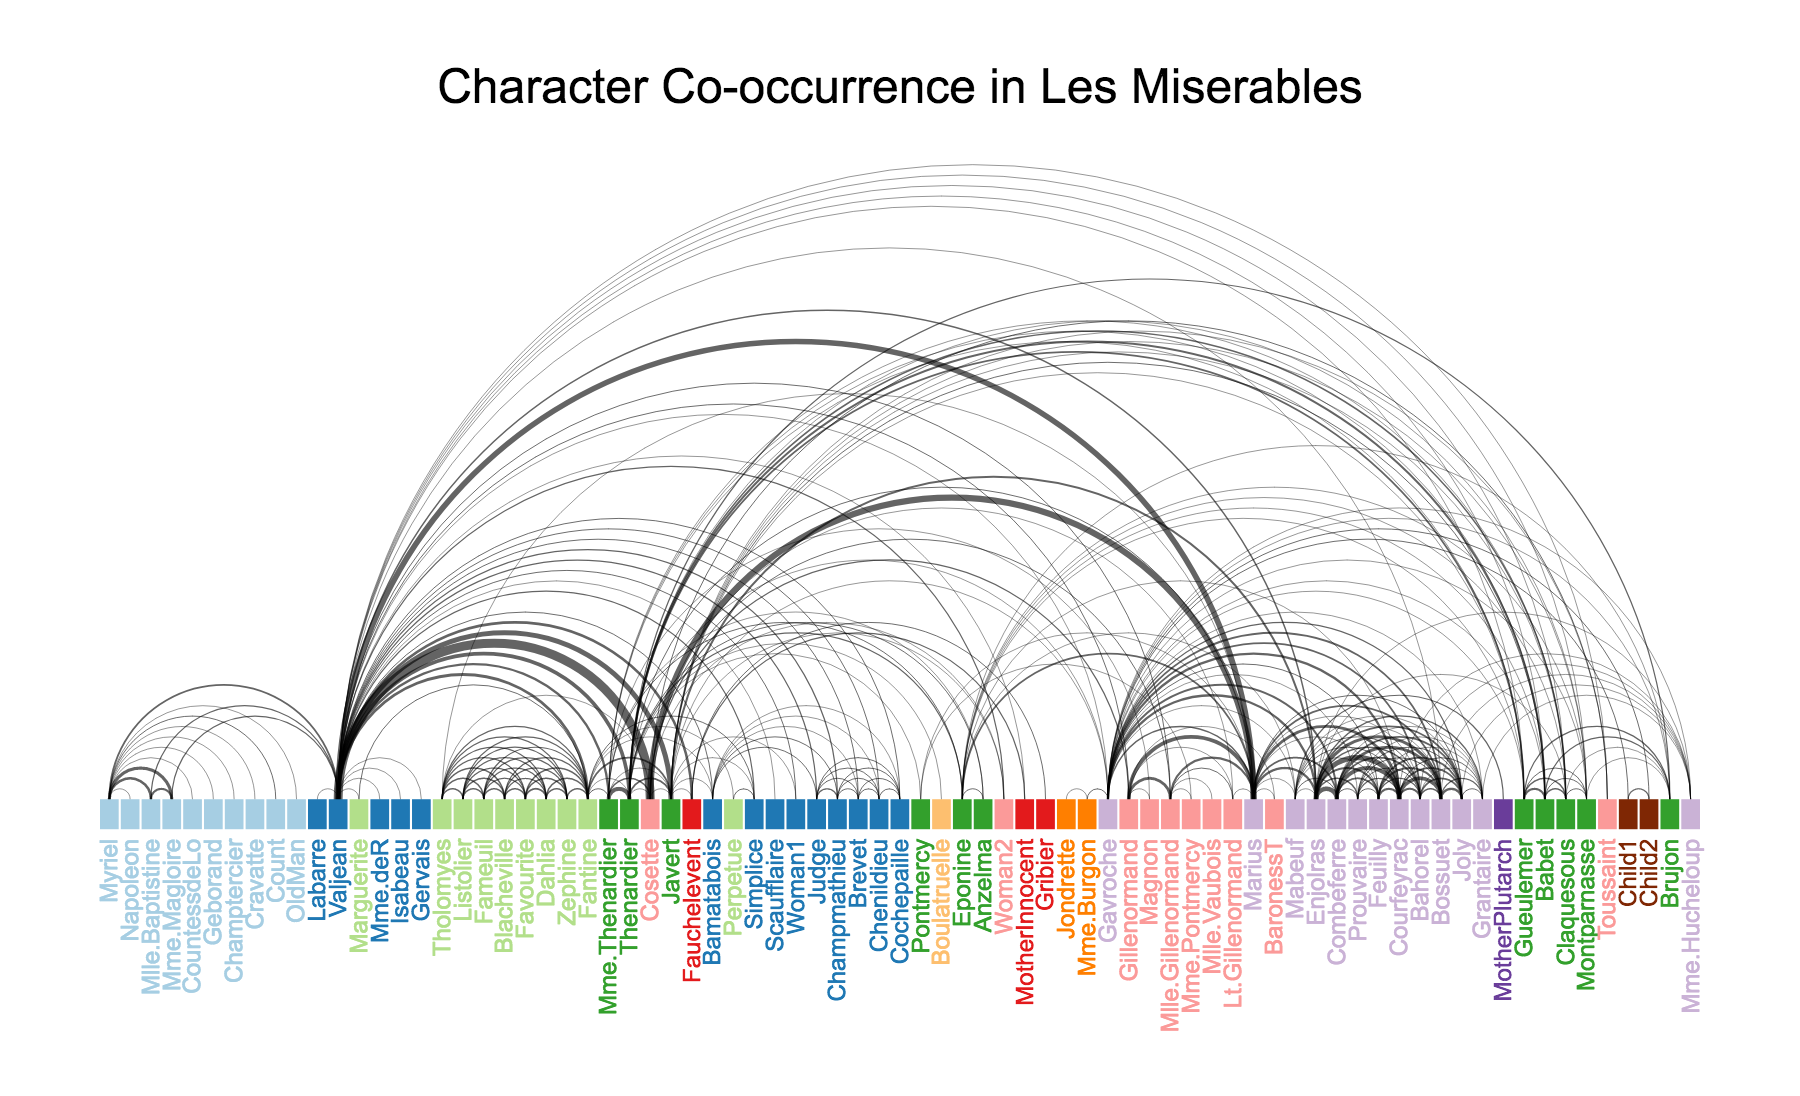
To draw charts with the links between glyphs, you will need two data tables: one for nodes/entities and another for links/relationships between nodes. For example, to draw the arc chart below (character co-ocurrence in Les Miserables), you will need one table for the characters and another for their co-occurrences.
Charticulator expects the nodes table to contain an id column and the links table to contain source_id and target_id columns, which refer to the ids in the nodes table, as illustrated below. Note that these column names are case sensitive.
| id | Name | Group |
|---|---|---|
| Myriel | Myriel | G01 |
| Napoleon | Napoleon | G01 |
| Valjean | Valjean | G02 |
| Marguerite | Marguerite | G03 |
| ... | ... | ... |
| source_id | target_id | Strength |
|---|---|---|
| Napoleon | Myriel | 1 |
| Valjean | Myriel | 5 |
| Marguerite | Valjean | 1 |
| ... | ... | ... |
Loading Data
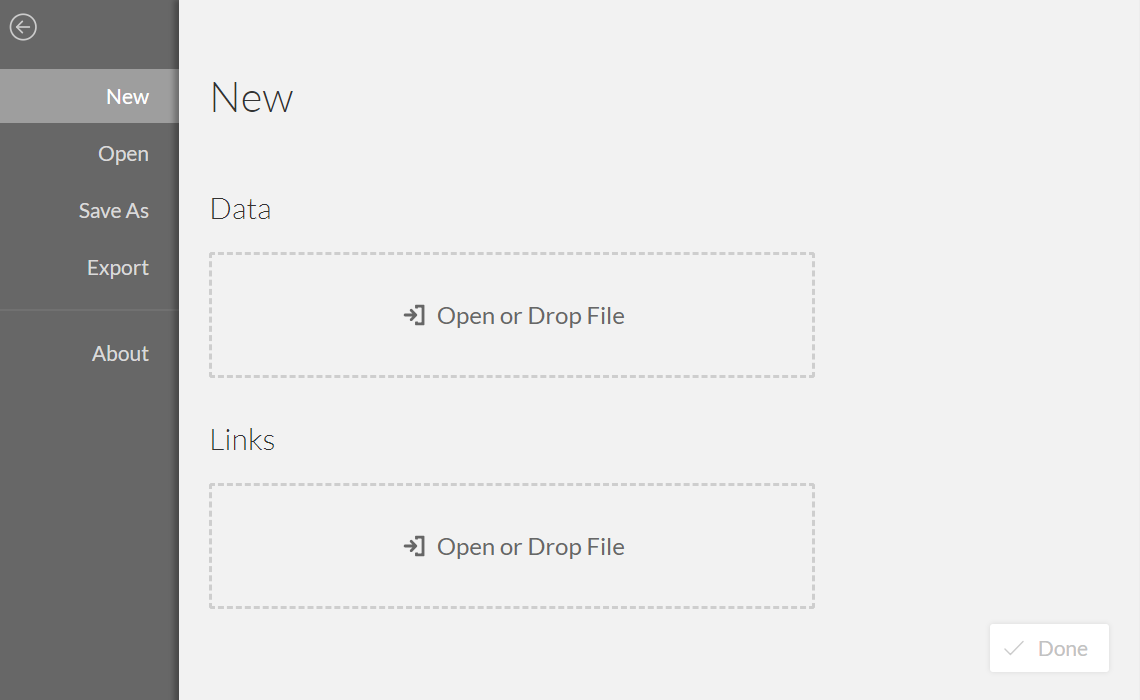
When you launch Charticulator, it automatically invokes the “New” chart command. Because you need to load data in order to create a chart, the New chart panel lets you select data files. You can click the button or drag a CSV file into the button area to open the data file.
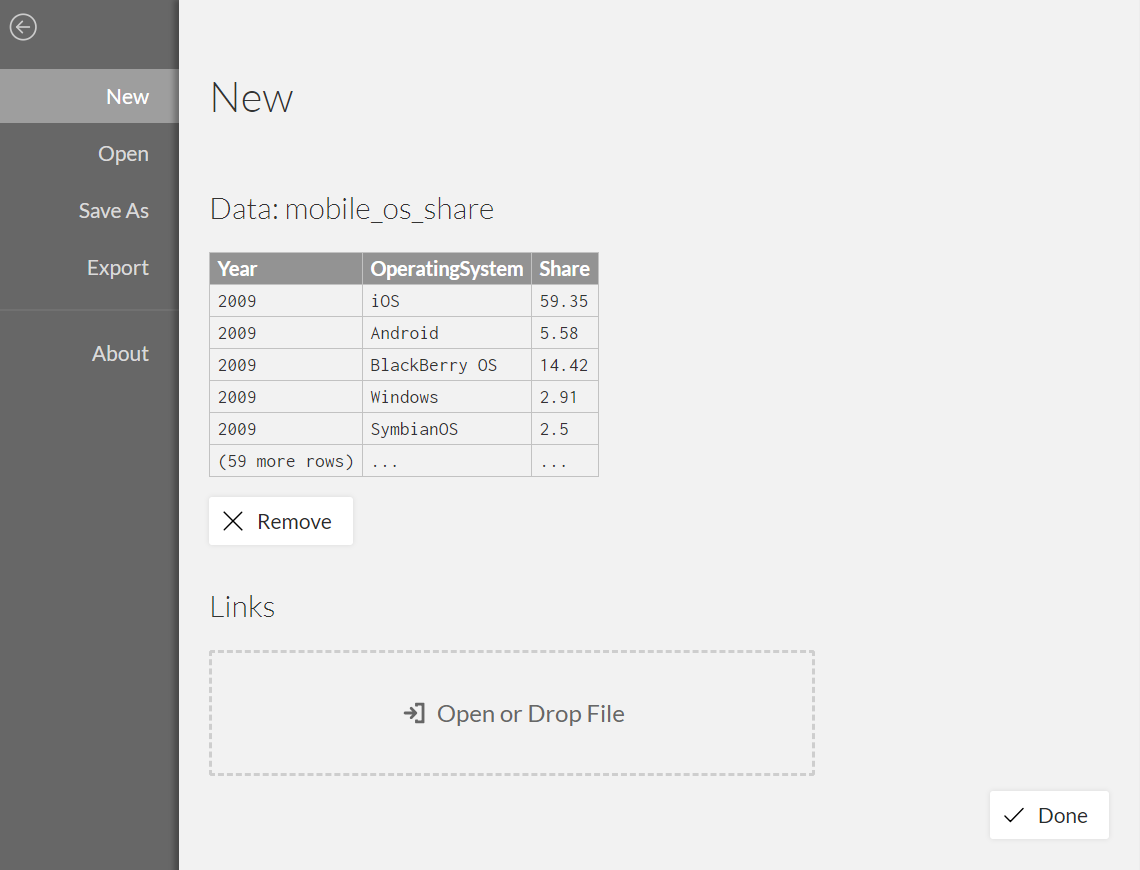
Once you choose the data file, Charticulator previews its top five rows.
Now you are ready to create a chart with Charticulator and follow along with our video tutorials. Also note that many of the charts in our gallery have an associated video of their creation process.